
With funding from the National Science Foundation ($1.5 million award), our research team is developing strategies and sharing examples of successful shrink-smart towns to help similar communities improve quality of life for their residents. Currently in pilot study, i.e., Iowa.
Table of contents
Motivation
Many small and rural communities in the United States are shrinking and evidence shows that this trend is unlikely to be reversed in most places. Research on rural decline has focused on documenting and observing these changes or promoting uncertain growth strategies that attempt to revive economic activity and reverse the population loss. Building on a pilot study funded by a Smart & Connected Communities planning grant ($100k award), this project makes a different argument about responding to population loss. We propose that communities should adapt to the shrinkage rather than fight it.
Project description
The long-term goals of the research are
- to overcome the rural data deficit by designing innovative and user-friendly methods for local data collection, analysis, and visualization that will empower leaders and residents in small communities to use data as a community resource; and,
- to share this knowledge with communities through a curriculum and other resources that are open-access and available online.
The central hypothesis in this project is that small communities working to implement the strategies we identify for rural smart shrinkage will benefit from data that enables them to make better local decisions, invest in building social capital, and protect quality of life and community services. To this end, we have assembled a multidisciplinary project team that brings together expertise in architecture, data science, economics, planning, rural sociology, statistics, and the visual arts. Additionally, the team will collaborate with ISU Extension & Outreach (ISU E&O), the Iowa League of Cities (ILC), and invited stakeholders from Iowa communities to develop a rural smart shrinkage curriculum.
My responsibilities and contribution
Overview
I aim to help towns bolster quality of life (QoL) amid rural depopulation by empowering town decision makers with QoL predictions and, eventually, more efficient public opinion polling. First, I train models for each of seven QoL measures: quality of
- public schools,
- medical services,
- housing,
- jobs,
- childcare services,
- senior citizen programs, and
- government services.
The dependent variables are seven aptly defined questions in the 2014 proprietary decennial Iowa Small Town Poll, which we seek to predict using publicly-available data. Provided the models are informative, we will then share our findings with town decision makers and use the implicit relationships captured in the model to improve public opinion polling.
I developed an accompanying Shiny app for EDA, cohort analysis, and communicating modeling results that will be made public as soon as the ISTP results are published. Project managment is carried out via Jira.
Data science pipeline
The diagram below is a simplified, linear version of the typical data science feedback loop:
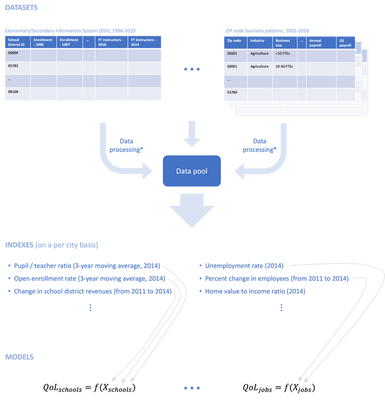
Datasets
First, I consult with domain experts (e.g., academics, city administrators, NGOs) to determine which variables are likely informative of people’s perceptions of, say, quality of public schools in their community. Next, either a fellow research assistant or I pull the relevant data programmatically, e.g., via an API. Finally, we perform the necessary data wrangling, which typically entails (see * in diagram above)
- various data cleaning operations (e.g., appending unique identifiers, fixing typos),
- joining datasets to create a time series,
- deflating any nominal figures, and
- changing support from school district, zip code, or county to city, when applicable.
Once the data pool is built, we can begin engineering features (a.k.a., indexes).
Indexes
Informative variables are often features derived from the data pool, as opposed to variables from the data pool itself. Some of the standard variable transformations used in the project include
- transforming a variable to “per capita basis,”
- computing a moving average,
- calculating a compound annual growth rates (CAGR),
- applying Box-Cox transformations, and/or
- simply creating a ratio by dividing two data pool variables.
Engineering other features, however, is more involved. For instance, two informative indexes I created:
- Lifetime Iowa Statewide Assessment of Student Progress (ISASP) index : a measure of a city’s students' all-time performance in the ISASP from 3rd grade to their respective current grades at time $t$.
- Employment supply : the estimated total number of jobs for companies located within an hour drive of a city divided by the population in that area and inversely weighted by travel time (to the respective job sources).
Models
We modeled the raw (ordinal) response, i.e., {poor, fair, good, very good}, as well as the mean response using the following models:
| Ordinal response | Mean response |
|---|---|
|
|
We used Leave-One-Out Cross-Validation (LOOCV) to find the “best” hyper-parameters. The primary tool for model assessment and selection has been plotting LOOCV predictions against the response. (For ordinal data, “response” in this context is the observed proportions of poor, fair, good, and very good.) On a technical note, the LOOCV predictions were produced using nested cross-validation, i.e., we perform parameter tuning on each LOOCV fold.
To date, I have obtained approximately normally distributed (nested) LOOCV residuals from modeling the mean response for the school, jobs, and housing QoL measures, respectively, using publicly-available data.
More efficient polling
Soon we will use the predictive models developed above and split-questionnaire design (SQD) to dramatically reduce the length of the ISTP survey. Traditional SQD splits questionnaires into several components. Each individual is asked to answer a subset of the components, and the results are combined at the end to produce statistically unbiased estimates to achieve better efficiency. We treat SQD as a probability-based sampling of questions, with the question selection probability tied to its uncertainty in the predictive model. If the answer of a question can be predicted with low uncertainty, it will have small or zero probability of being selected. This guarantees that more data are collected on questions with large uncertainty. We will optimize the selection probability based on information criterion and a constraint on the total number of questions for each individual to minimize the respondent burden. Parameter estimation and uncertainty quantification under this new double sampling design framework will also be developed.
Next steps
In the coming months, I’ll continue writing the journal article “Quality of life modeling and efficient public polling for town decision makers” which will capture the modeling experience to date; we aim to publish in Stat, an ISI journal. Additionally, I will make progress towards modeling the other four QoL measures, as well as the split questionnaire designs.